Unfortunately, none of our teams from the EdAppHack competition moved forward, but I am proud of the efforts they put forward.
I let one of the members of the Yearbook committee borrow the SD card from the camera and was not able to upload the most recent photos of the Book Talk presenters. Here are a few shots, from the first day, taken by Tonny:
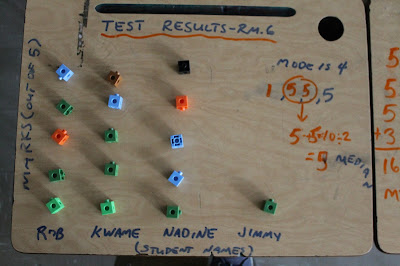
We did this really nifty exercise to review Mean, Median, and Mode with cube links, but the photos of it are on the card. I will upload them, as soon as I get the card back. The idea of the exercise can be seen in this screenshot from a Promethean lesson I did:
So, the images of the graphs are taken from an old, 90s PBS show called Math Talk. In this episode, they were trying to display how the idea of an "average," or mean, can be seen as a way of balancing out. In the images, you can see that the information is about the consumption of doughnuts. So far, we know how to calculate the average and you can see the results of this particular set of data. If the mean is 200, it means -- no pun intended -- that if we could balance out the doughnut consumption across the 4 people, they would each eat 200 of them.
In the exercise we did, we had some fun playing around with the cubes and I think it important that it be uploaded and reviewed. It contains some important information that will assist the students in grasping the key ideas laid out in the Data Management strand around mean, median, and mode. I will get on that, as soon as I have the card.
**I have the card!!**
 |
| Original question |
 |
| Looking at the mean, median, and mode |
 |
| The idea of mean is that the results are distributed evenly or balanced out. In this case, the average or mean is 4. |
 |
The example I am going to use is based on this story: http://www.thestar.com/news/immigration/2014/07/01/legislated_racism_commemorated_on_canada_day.html. Originally, it was from an image from a story on one of the the last "missing" railway spikes used in the Canadian Pacific Railway, but I can't seem to find the clipping from The Toronto Star (see story: http://www.ourwindsor.ca/news-story/6441884-the-lost-spike-has-been-found-in-gatineau/)
Here is a Historica Canada YouTube video on an experience of some of the the early Chinese Canadians.
The Chinese Head Tax is closely connected to the completion of the railway in the late 1880s. Some of that information is summarized from this Wikipedia entry: https://en.wikipedia.org/wiki/Chinese_head_tax_in_Canada.
Here is a video of the daughter of a Chinese Canadian, who had to pay the Head Tax:
 |
| photo courtesy CBC Weather page |
homework:


No comments:
Post a Comment